
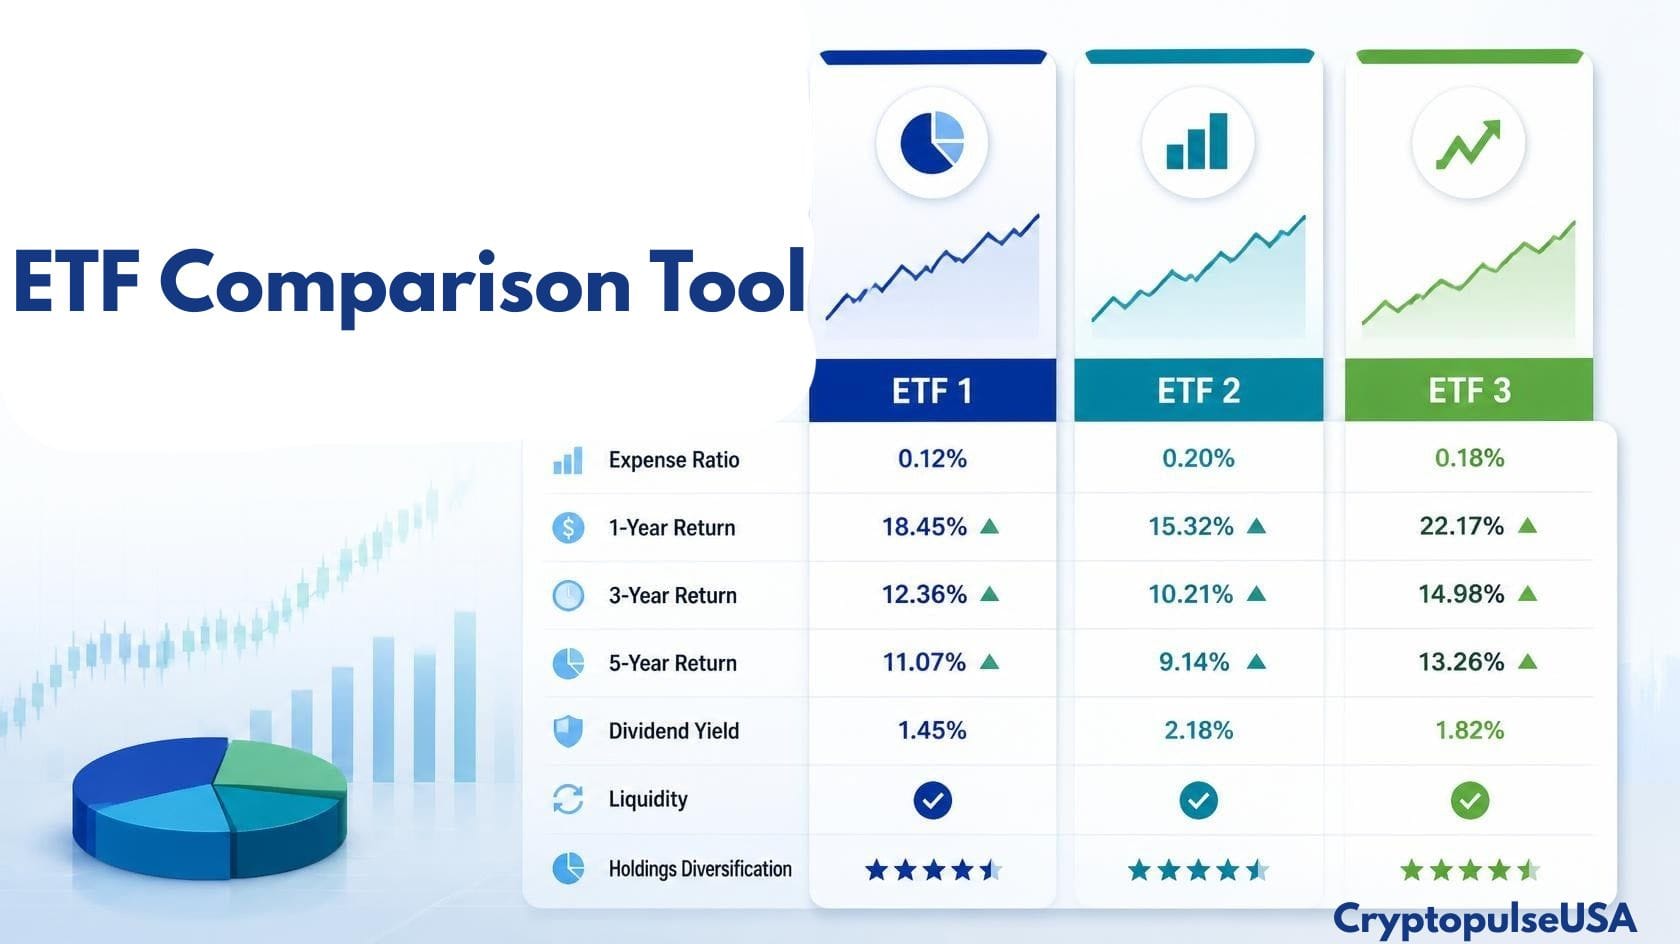
Choosing between two ETFs can be harder than it looks. Two funds may follow similar markets but have different expense ratios, holdings, performance, dividends, risk levels, and trading costs. An ETF comparison tool makes this research easier by putting important fund information side by side. Instead of checking several websites and comparing numbers manually, you can compare ETFs in one place. Use an ETF comparison tool to examine expense ratios, holdings, performance, Etf dividends, assets under management, risk, sector exposure, ETF overlap, liquidity, and benchmark information before making an investment decision.
The important point is that there is no single number that tells you which ETF is best. A good comparison looks at the complete picture.
What Is an ETF Comparison Tool?
An ETF comparison tool is an online research tool that lets investors compare two or more exchange-traded funds side by side.
Depending on the tool, you may be able to compare:
- Expense ratios
- ETF holdings
- Historical returns
- Dividend yield
- Assets under management
- Number of holdings
- Sector exposure
- Geographic exposure
- Volatility
- Maximum drawdown
- Sharpe ratio
- Trading volume
- Bid-ask spread
- Benchmark
- Fund issuer
- ETF overlap
- Tracking difference
- Fund size
What Does an ETF Comparison Tool Do?
In simple terms, it answers questions such as:
- Which ETF has the lower expense ratio?
- Which ETF has performed better over a specific period?
- Do these ETFs hold the same stocks?
- Which ETF has more concentrated holdings?
- Which fund pays a higher dividend?
- Which ETF has greater assets under management?
- How different are the two funds?
- Are two ETFs actually providing different exposure?
- Which ETF may fit a particular investment goal better?
The tool provides the data. You still need to decide whether an ETF is appropriate for your portfolio.
How to Use an ETF Comparison Tool
Using an ETF compare tool is usually straightforward.
Step 1: Enter the ETF Tickers
Enter the ticker symbols for the funds you want to compare.
For example:
- VOO
- SPY
- IVV
These funds can be compared because they all provide exposure to the U.S. large-cap stock market, although their structures, costs, trading characteristics, and other details differ.
Step 2: Select the ETFs
Choose two or more ETFs if the tool supports multiple-fund comparisons. For the most useful comparison, start with funds that have a similar investment objective.
For example:
- VTI vs ITOT
- SPY vs IVV
- IWM vs VB
- SCHD vs VYM
Comparing funds with completely different objectives can still be useful, but the results need more context.
Step 3: Compare the Key Metrics
Start with the basics:
- Investment objective
- Benchmark
- Expense ratio
- Holdings
- AUM
- Performance
- Dividends
- Risk
- Liquidity
- ETF overlap
Do not immediately choose the ETF with the highest return.
Step 4: Look at the Differences
Ask: Why are these ETFs different?
A fund may have a higher return because it has greater exposure to a particular sector or group of stocks. Another ETF may have a lower expense ratio but different holdings or a different index methodology. Understanding the reason behind the difference is more useful than simply looking at the winning number.
Step 5: Check the Data Date
ETF data changes. Holdings can change because funds rebalance or companies enter and leave an index. AUM, price, dividend yield, and other figures can also change.
Always check the as-of date when reviewing ETF data. Some comparison tools now explicitly show the date of the underlying holdings data because overlap results can change when funds report holdings on different schedules.
Step 6: Verify Important Information
For an important investment decision, check the ETF issuer’s latest:
- Fund fact sheet
- Prospectus
- Holdings file
- Expense information
- Distribution information
A comparison tool is useful for research, but it should not replace official fund documents.
What Should You Compare When Comparing ETFs?
A strong ETF comparison should go beyond performance and fees. Here are the most important factors to review.
1. ETF Expense Ratio
The expense ratio is one of the first numbers investors usually check. It represents the fund’s annual operating expenses as a percentage of assets. For example, if an ETF has an expense ratio of 0.10%, the annual fund expense is approximately $1 for every $1,000 invested, before considering the effects of investment performance and other costs. A lower expense ratio can be helpful, particularly when comparing funds with similar exposure. However, the cheapest ETF is not automatically the best ETF.
A fund with a slightly higher expense ratio may have different exposure, better tracking, stronger liquidity, or another feature that matters to a particular investor.
Why ETF Fees Matter
Even small differences can compound over many years. When two ETFs provide nearly identical exposure, comparing their costs becomes especially important. But do not look only at the expense ratio. Also consider the fund’s actual tracking difference and trading costs.
2. ETF Holdings Comparison
ETF holdings show what the fund actually owns.
A comparison should ideally show:
- Number of holdings
- Largest holdings
- Top 10 holdings
- Individual holding weights
- Shared holdings
- Concentration
- Sector exposure
For example, two ETFs may both be described as technology funds, but one could have a much larger position in a few companies. That difference can affect both performance and risk.
Why Holdings Matter
The ETF name tells you what the fund is designed to do. The holdings tell you what you actually own. That is why ETF holdings comparison should be an important part of your research.
3. ETF Overlap
ETF overlap shows how much two funds have in common. This is one of the most useful features to add to an ETF comparison tool. Two ETFs can have different names and still own many of the same companies.
For example, an investor might own:
- A broad-market ETF
- An S&P 500 ETF
- A growth ETF
- A technology ETF
At first glance, this may look highly diversified. But several of those funds may contain the same large companies.
Why ETF Overlap Matters
High overlap can mean that adding another ETF does not provide as much diversification as expected. You may effectively be increasing exposure to the same companies or sectors.
How Is ETF Overlap Calculated?
There is no single universal definition of overlap. One common weighted method compares the weights of shared holdings and adds the smaller weight for each common security.
For example, if ETF A has a stock at 7% and ETF B has the same stock at 5%, the overlapping exposure for that stock would be 5% under this method. The calculation is then repeated for other shared holdings. Some tools also report count overlap, which looks at how many holdings are shared rather than how much portfolio weight they represent. These are different measurements and should not be confused.
Why Overlap Numbers Can Differ
You may find different overlap percentages for the same two ETFs on different websites. That does not automatically mean one source is wrong.
The result can differ because of:
- Different holdings dates
- Different data providers
- Different overlap formulas
- Different treatment of cash
- Different security matching methods
- Different fund reporting schedules
For this reason, a good ETF overlap tool should explain how its number is calculated and show the holdings’ as-of date.
4. ETF Performance Comparison
Historical performance is another major part of an ETF comparison.
You may compare:
- 1-year return
- 3-year return
- 5-year return
- 10-year return
- Since-inception return
But make sure you are comparing the same type of return over the same time period.
Annualized Return vs Total Return
These are not the same thing. A cumulative return shows how much an investment changed over a period. An annualized return converts the result into an average yearly rate.
Price Return vs Total Return
A price return focuses on changes in the ETF’s price. A total return generally accounts for distributions such as dividends, depending on the methodology. For dividend-paying ETFs, total return can provide a more complete picture of historical investment performance.
Important Warning About Historical Performance
A fund that performed best in the past may not perform best in the future. Historical performance is useful for understanding what happened. It is not a guarantee of future results.
5. ETF Dividend Comparison
If you are looking for investment income, compare:
- Dividend yield
- Distribution frequency
- Distribution history
- Dividend growth
- Total return
- Distribution consistency
A high dividend yield can look attractive, but it does not automatically mean a better investment.
Dividend yield can change as:
- distributions change
- the ETF price changes
- market conditions change
Dividend Yield vs Total Return
An ETF with a lower dividend yield can still produce a higher total return.
This is why investors should not choose an ETF based only on its dividend yield.
6. ETF Risk Comparison
Risk is more complicated than simply asking which ETF is “safer.”
A useful comparison may include:
- Volatility
- Standard deviation
- Maximum drawdown
- Beta
- Sharpe ratio
- Concentration risk
- Sector risk
- Geographic risk
Volatility
Volatility measures how much an investment’s price has moved around its average over a particular period. Higher historical volatility generally means larger price movements.
Maximum Drawdown
Maximum drawdown measures the largest decline from a previous peak during a selected period. It helps show how much an investor could have lost during a major decline.
Sharpe Ratio
The Sharpe ratio compares historical excess return with volatility. It can help compare risk-adjusted historical performance, but it should not be used by itself.
Why No Single Risk Metric Is Enough
Volatility, maximum drawdown, and Sharpe ratio measure different things. A good comparison should look at several metrics together rather than declaring an ETF “best” based on one number.
7. Sector Exposure
Sector exposure can have a major impact on ETF performance.
Compare exposure to sectors such as:
- Technology
- Financials
- Healthcare
- Industrials
- Energy
- Consumer discretionary
- Consumer staples
- Communication services
- Utilities
- Real estate
- Materials
Two ETFs can both be classified as U.S. equity ETFs while having very different sector allocations.
Why Sector Exposure Matters
If you already own a technology-heavy portfolio, adding another ETF with a large technology allocation may increase concentration rather than diversification.
8. Geographic Exposure
For international and global ETFs, compare:
- United States
- Developed markets
- Emerging markets
- Europe
- Asia-Pacific
- Individual country exposure
Geographic diversification can affect how a portfolio responds to:
- currency movements
- economic growth
- interest rates
- political events
- regional market conditions
9. Market-Cap Exposure
Check whether the ETF focuses on:
- Large-cap companies
- Mid-cap companies
- Small-cap companies
- Micro-cap companies
A large-cap ETF can behave differently from a small-cap ETF even if both invest in U.S. companies.
10. Benchmark and Index
One of the most important questions is: What index does the ETF track? Do not assume two ETFs are the same because they have similar names.
Compare:
- Benchmark
- Index methodology
- Rebalancing rules
- Weighting methodology
- Number of securities
- Selection criteria
Market-Cap Weighted vs Equal Weighted
A market-cap-weighted ETF gives larger companies greater portfolio weights. An equal-weighted ETF attempts to give companies similar weights. That difference can significantly change portfolio behavior.
Growth vs Value
Two broad-market ETFs can also have different exposure to growth and value stocks. Always look at the index methodology before deciding that two funds are interchangeable.
11. Tracking Difference
A useful ETF comparison should also consider tracking difference. Tracking difference is the gap between an ETF’s performance and the performance of the index it is designed to track.
For example, an ETF may have a 0.10% expense ratio but experience a different actual return relative to its benchmark. Why?
Possible reasons include:
- Fund expenses
- Trading costs
- Portfolio management
- Taxes
- Securities lending
- Cash management
- Index rebalancing
- Replication method
This is why the expense ratio should not be treated as the complete cost of owning an ETF. Some comparison tools specifically highlight tracking difference as a way to evaluate how closely a fund follows its benchmark.
12. ETF Liquidity and Trading Costs
A fund can have a low expense ratio but still be less attractive for certain trading strategies if its trading costs are higher.
Compare:
Trading Volume
Higher trading volume can sometimes indicate stronger market activity.
Bid-Ask Spread
The bid-ask spread is the difference between the price buyers are willing to pay and the price sellers are asking. A smaller spread generally means lower immediate trading friction.
Assets Under Management
AUM tells you the approximate amount of assets held by the fund. A larger AUM does not automatically mean a better ETF, but it can provide useful context about fund size.
Premium or Discount to NAV
ETFs trade throughout the day, and their market price can temporarily differ from net asset value. This is another useful metric for investors to understand.
13. ETF Concentration
Diversification is not only about the number of holdings. An ETF can hold hundreds of stocks while still being heavily influenced by a small number of large companies.
Compare:
- Top 5 holdings
- Top 10 holdings
- Largest holding
- Sector concentration
- Geographic concentration
Example
ETF A may hold 500 stocks but have a large percentage of its portfolio concentrated in its biggest companies. ETF B may have fewer holdings but distribute its weight more evenly. The number of holdings alone does not tell you everything about diversification.
14. ETF Fund Size and AUM
Assets under management can help investors understand a fund’s scale. However: AUM is not a quality score. A larger ETF is not automatically better.
Use AUM alongside:
- Trading volume
- Bid-ask spread
- Expense ratio
- Holdings
- Fund age
- Investment objective
15. ETF Issuer
Compare the fund provider as well.
Examples of major ETF issuers include:
- Vanguard
- BlackRock/iShares
- State Street
- Invesco
- Schwab
- Fidelity
The issuer can provide important information about the fund’s documentation, methodology, holdings, and investment structure. But the issuer’s reputation should not replace analysis of the individual ETF.
Also Read: Dollar ETF
ETF Comparison Example: VOO vs SPY vs IVV
A useful way to understand an ETF comparison tool is to look at three well-known S&P 500 ETFs. VOO, SPY, and IVV all provide exposure to the S&P 500, but investors should still compare their:
- Expense ratios
- AUM
- Holdings
- Trading volume
- Bid-ask spreads
- Dividends
- Tracking difference
- Fund structure
- Tax considerations
- Investment purpose
The important lesson is not simply which one has the highest historical return. Because the funds target similar exposure, small differences in cost, implementation, liquidity, and tracking can become more important. This is exactly where an ETF comparison tool becomes useful.
How to Choose the Right ETF After Comparing Funds
After comparing ETFs, do not ask only, “Which ETF won?” Instead, ask: “Which ETF fits my investment goal, risk level, and overall portfolio?” The best ETF on paper may not be the best ETF for you. A low expense ratio, high dividend yield, or large asset base alone does not make a fund the right choice. Use the following steps before making a decision.
Step 1: Define Your Investment Goal
Start by deciding what you want the ETF to do in your portfolio.
Your objective might be:
- Long-term growth
- Dividend income
- Regular monthly income
- Broad diversification
- International exposure
- Sector exposure
- Retirement investing
- Bond exposure
- Capital preservation
- Inflation protection
- Higher-risk growth
Your goal should determine which ETFs you compare. For example, comparing a Treasury bond ETF with a technology ETF simply because both are ETFs does not provide a meaningful comparison. Compare funds that are designed to serve a similar purpose.
Step 2: Compare Similar Funds
Once you know your goal, compare ETFs with similar investment objectives. If your goal is S&P 500 exposure, compare ETFs that track the S&P 500. If your goal is dividend income, compare dividend-focused ETFs.
If your goal is bond income, compare similar bond ETFs. This creates a more meaningful comparison because you are evaluating funds that solve the same investment problem.
Step 3: Compare Costs
Costs can have a significant effect on long-term returns.
Look at:
- Expense ratio
- Tracking difference
- Trading costs
- Bid-ask spread
- Any additional fund expenses
Do not automatically choose the ETF with the lowest expense ratio. A slightly more expensive fund may provide better tracking, liquidity, or another feature that matters to you. The important thing is to compare the overall cost of owning the ETF, not just one number.
Step 4: Compare Holdings
Look at what the ETF actually owns. Ask:What companies, bonds, or other assets am I actually buying?
Check:
- Top holdings
- Number of holdings
- Largest position
- Sector allocation
- Geographic exposure
- Asset type
- Credit quality for bond funds
- Portfolio concentration
Two ETFs can have similar names but very different portfolios.
Step 5: Check Portfolio Overlap
This is one of the most overlooked steps when comparing ETFs. You may already own many of the same companies through another ETF. For example, buying a broad-market ETF and a technology ETF could increase your exposure to some of the same large technology companies. Portfolio overlap is not automatically bad. However, you should understand how much exposure you are creating.
Ask:
- Do I already own these companies?
- Is the new ETF adding diversification?
- Or am I simply increasing exposure to holdings I already have?
Step 6: Compare Dividend or Distribution Quality
If income is one of your goals, do not compare ETFs based only on the advertised yield.
Look at:
- Distribution yield
- Distribution history
- Distribution frequency
- Distribution growth or decline
- Source of the distributions
- Return of capital
- Total return
A high distribution does not automatically mean a better investment. For example, one ETF may have a lower yield but stronger long-term total returns, while another may offer a higher distribution but experience greater price declines. This is why ETF dividend yield should be evaluated together with total return and risk.
Step 7: Compare Total Return
Income is only one part of an ETF’s performance. Total return considers both the change in the ETF’s value and distributions received by investors. For example, an ETF paying a high distribution can still produce a poor overall result if its price or NAV falls significantly.
When comparing funds, ask: “How has this ETF performed after considering both distributions and price changes?”
Do not judge an ETF only by its dividend yield.
Step 8: Consider Tax Treatment
Taxes can affect the amount of investment income you actually keep. Depending on the ETF and your account, distributions may include different types of income, such as:
- Qualified dividends
- Ordinary income
- Interest income
- Capital gains
- Return of capital
If you are investing through a taxable account, understand how the ETF’s distributions may be treated for tax purposes. Your personal tax situation can be different from another investor’s, so consider professional tax advice when necessary.
Step 9: Consider Risk
Every ETF has risks.
Look at:
- Volatility
- Maximum drawdown
- Concentration
- Sector exposure
- Interest-rate risk
- Credit risk
- Currency risk
- Market risk
The type of ETF matters here. For example, a long-duration Treasury ETF can have significant interest-rate sensitivity, while a sector ETF can be heavily affected by the performance of one industry. A higher potential income or return usually should not be considered separately from the risk required to achieve it.
Step 10: Consider Liquidity
Liquidity matters when buying or selling an ETF. Especially if you plan to trade frequently, check:
- Trading volume
- Bid-ask spread
- Assets under management (AUM)
- Average daily trading activity
A liquid ETF with a tighter bid-ask spread can generally be easier and potentially less costly to trade. However, trading volume alone should not determine your investment decision.
Step 11: Check the Fund’s Tracking Difference
If an ETF is designed to follow an index, check how closely it has actually followed that index. This is known as tracking difference. A fund may have a very low expense ratio but still produce a larger difference from its benchmark because of expenses, portfolio management, taxes, trading costs, or other factors. For index ETFs, compare: Index performance vs. ETF performance over an appropriate period.
Step 12: Check the ETF’s Age and Fund Size
A fund’s age and size can provide additional context.
Consider:
- Assets under management
- How long the ETF has existed
- Growth or decline in assets
- Trading activity
- Whether the fund has a long enough performance history for your comparison
A newer ETF is not necessarily bad, but it may have less historical data available. Likewise, a large ETF is not automatically better. Use fund size as one piece of information rather than as a final decision rule.
Step 13: Understand the ETF’s Strategy
Read the fund’s objective and strategy before investing. Some ETFs simply track an index.
Others may use:
- Active management
- Covered calls
- Options
- Leverage
- Inverse strategies
- Bond ladders
- Factor investing
- Sector concentration
Two ETFs can both advertise themselves as income funds while using completely different strategies. Understanding the strategy helps you understand where the ETF’s income and risks come from.
Step 14: Check Your Existing Portfolio
Finally, look at the ETF in the context of your entire portfolio. An ETF that looks attractive by itself may not improve your overall portfolio.
Ask:
- Does it diversify my existing investments?
- Does it increase concentration?
- Does it add unnecessary risk?
- Does it match my asset allocation?
- Does it help me reach my long-term goal?
The right ETF is not necessarily the one with the highest return or highest yield. It is the one that makes sense within your overall investment strategy.
Quick ETF Comparison Checklist
Before choosing between two or more ETFs, check:
| Factor | What to Ask |
|---|---|
| Investment goal | Does the ETF match my objective? |
| Holdings | What am I actually buying? |
| Expense ratio | How much does the fund cost? |
| Tracking difference | How closely does it follow its benchmark? |
| Dividend/distribution | How much income does it provide? |
| Distribution quality | Where does the income come from? |
| Total return | What has the overall performance been? |
| Risk | How much volatility and drawdown should I expect? |
| Portfolio overlap | Do I already own similar holdings? |
| Liquidity | Is the ETF easy and reasonably efficient to trade? |
| Fund size | Is there sufficient scale and trading activity? |
| Strategy | How does the ETF generate returns or income? |
| Taxes | How might distributions be treated? |
| Portfolio fit | Does it improve my overall portfolio? |
ETF Comparison Tool vs ETF Screener
These tools serve different purposes.
| ETF Comparison Tool | ETF Screener |
|---|---|
| Compares selected ETFs | Finds ETFs |
| Side-by-side analysis | Filters a large universe |
| VOO vs SPY | Find ETFs under a specific expense ratio |
| Compare holdings | Search by asset class |
| Compare performance | Search by strategy |
| Compare risk | Search by dividend yield |
An ETF screener helps you discover candidates. An ETF comparison tool helps you evaluate selected candidates. Many professional ETF research platforms provide both functions.
ETF Comparison Tool vs ETF Overlap Tool
These tools are related but not identical. An ETF comparison tool may compare:
- Costs
- Performance
- Holdings
- Dividends
- Risk
- AUM
- Benchmark
- Liquidity
An ETF overlap tool focuses more specifically on:
- Shared holdings
- Weight overlap
- Duplicate exposure
- Portfolio concentration
For example, two ETFs may both have similar historical returns but very different holdings. Or they may have different names but substantial exposure to the same companies. Using both types of analysis can provide a clearer picture of diversification.
Common ETF Comparison Mistakes
Choosing the ETF With the Highest Return
Past performance does not guarantee future performance.
Choosing Only by Expense Ratio
Fees matter, but they are only one part of ETF analysis.
Ignoring Holdings
You should know what companies or securities your ETF owns.
Ignoring ETF Overlap
Several ETFs can create concentrated exposure to the same companies.
Ignoring the Benchmark
Similar names do not always mean identical investment strategies.
Ignoring Liquidity
Trading costs can matter, particularly for frequent traders.
Looking Only at Dividend Yield
A high yield does not automatically mean higher total returns.
Ignoring Concentration
An ETF can have many holdings but still be dominated by a few large positions.
Comparing Different Time Periods
Compare the same periods when reviewing historical performance.
Ignoring Tracking Difference
The stated expense ratio does not tell you the complete story of how closely an ETF follows its benchmark.
Assuming More ETFs Means More Diversification
Five ETFs can still provide exposure to many of the same companies.
Using Old Data
ETF holdings and other fund information change.
Always check the data date.
What Makes a Good ETF Comparison Tool?
A useful ETF comparison tool should do more than display two expense ratios.
Ideally, it should provide:
- Side-by-side comparison
- Current fund information
- Expense ratios
- Holdings
- Historical performance
- Dividend information
- Risk metrics
- ETF overlap
- Sector exposure
- Geographic exposure
- Benchmark information
- AUM
- Trading information
- Data update dates
- Clear methodology
- Data sources
- Explanations in simple language
The best comparison experience should help users understand why two ETFs are different, rather than simply highlighting a numerical winner. Current ETF comparison platforms already compete on cost, performance, holdings, flows, factors and other fund characteristics, so providing transparent methodology and portfolio-level context can make a comparison page more useful.
How Often Should ETF Data Be Updated?
Not every ETF metric changes at the same speed.
For example:
| Information | Can Change |
|---|---|
| ETF Price | Throughout the trading day |
| Trading Volume | Throughout the trading day |
| AUM | Regularly |
| Holdings | According to fund disclosures |
| Expense Ratio | When fund costs change |
| Dividend Data | When distributions are declared |
| Index Methodology | When the index provider changes rules |
| Historical Returns | As new market data becomes available |
This is why a good comparison page should show when the information was last updated. Holdings are particularly important because they can be reported on different schedules. Some comparison tools use issuer feeds and SEC filings and explicitly identify the underlying holdings date.
ETF Comparison Data: What Do the Numbers Mean?
If you are new to ETFs, these terms can be confusing.
Expense Ratio
The annual operating expense charged by the fund, expressed as a percentage of assets.
AUM
Assets under management. It represents the approximate value of assets managed by the ETF.
NAV
Net asset value. It represents the value of the fund’s assets minus liabilities on a per-share basis.
Bid-Ask Spread
The difference between the current buying and selling prices.
Benchmark
The index or investment benchmark the ETF is designed to track or outperform.
Tracking Difference
The difference between an ETF’s return and its benchmark’s return over a period.
Volatility
A measure of how much returns or prices have historically fluctuated.
Maximum Drawdown
The largest decline from a previous peak during a selected period.
Dividend Yield
A measure of distributions relative to the ETF’s price, based on the specific calculation and period used.
ETF Overlap
A measure of how much exposure two ETFs have in common.
Holdings
The securities owned by the ETF.
Understanding these terms makes it much easier to use an ETF comparison calculator or ETF research tool correctly.
How to Compare ETFs for Long-Term Investing
Long-term investors should look beyond one year’s performance.
Consider:
- Expense ratio
- Tracking difference
- Long-term total return
- Holdings
- Diversification
- Concentration
- Risk
- Liquidity
- Fund size
- Investment objective
A fund with a strong recent return may not be the best fit for your long-term strategy. Your existing portfolio also matters. For example, if you already have substantial exposure to large U.S. technology companies, adding another technology-heavy ETF may increase concentration rather than diversification.
How to Compare ETFs for Dividend Income
If income is your priority, compare:
- Dividend yield
- Distribution history
- Distribution frequency
- Dividend growth
- Portfolio quality
- Sector concentration
- Total return
- Expense ratio
Do not assume that the highest-yielding ETF is automatically the best dividend ETF. A sustainable income strategy requires more analysis than simply sorting ETFs by yield.
How to Compare ETFs for Growth
Growth-oriented investors may want to examine:
- Historical total returns
- Growth-stock exposure
- Sector allocation
- Top holdings
- Volatility
- Drawdowns
- Valuation characteristics
- Expense ratio
- Benchmark methodology
Growth ETFs can have greater concentration and volatility, so performance should always be considered alongside risk.
Why ETF Overlap Can Change Your Portfolio Risk
Suppose you own three ETFs. Each ETF may appear different:
- Broad U.S. market
- Large-cap growth
- Technology
But they may share many of the same large companies. That means your portfolio could have more exposure to certain stocks than you realize. This is why portfolio overlap is important. The goal is not necessarily to eliminate all overlap. Sometimes holding similar funds can be intentional. For example, investors may deliberately hold multiple funds with similar exposure for account-specific or tax-related reasons. The important thing is to understand the overlap rather than accidentally creating it.
ETF Comparison Methodology
A trustworthy ETF comparison tool should explain how its numbers are produced. For example, if calculating holdings overlap, explain:
- What data source is used
- Holdings as-of date
- How securities are matched
- Whether cash is included
- Whether weight overlap or count overlap is being shown
- How missing holdings are handled
This matters because different methodologies can produce different results. For example, one overlap calculation may measure shared portfolio weight while another may simply count shared securities. Neither number should be presented without explaining what it means. Some current ETF overlap tools explicitly document their formulas, security matching rules, data sources, and limitations.
Important Limitations of ETF Comparison Tools
No comparison tool can predict which ETF will perform best in the future. ETF data can also have limitations.
Holdings Are Snapshots
A holdings report represents the fund at a particular point in time. The fund can trade after that report.
Historical Performance Is Not a Forecast
Past returns do not guarantee future returns.
AUM Is Not a Quality Rating
A larger fund is not automatically better.
High Overlap Does Not Mean Identical Performance
Two ETFs can hold many of the same companies but assign different weights to them.
Data Can Have Different Update Schedules
One fund may have newer holdings data than another.
Risk Metrics Depend on the Measurement Period
A fund’s volatility over five years may look different from its volatility over one year.
These limitations should be visible to users instead of hidden in small print.
FAQs ETF Comparison Tools
What is an ETF comparison tool?
An ETF comparison tool lets investors compare exchange-traded funds side by side using metrics such as expense ratio, holdings, performance, dividends, risk, AUM, sector exposure, and ETF overlap.
How do I compare two ETFs?
Start by comparing their investment objectives, benchmarks, expense ratios, holdings, historical total returns, dividends, risk, liquidity, and overlap. Then consider which ETF better fits your portfolio and investment goal.
What is the best ETF comparison tool?
The best tool depends on what you need. A useful comparison tool should provide reliable and current data, side-by-side metrics, holdings, performance, costs, risk information, overlap analysis, and transparent methodology.
Is a lower ETF expense ratio always better?
No. A lower expense ratio can be beneficial, but it should be considered alongside tracking difference, holdings, liquidity, performance, and the ETF’s investment strategy.
How do I compare ETF holdings?
Compare the number of holdings, largest positions, individual weights, sector exposure, geographic exposure, and shared holdings. Looking at the actual portfolio can reveal differences that are not obvious from the ETF name.
What is ETF overlap?
ETF overlap measures how much exposure two funds have in common. Depending on the methodology, it can measure shared holdings or the amount of portfolio weight represented by common securities.
Why do ETF overlap percentages differ between websites?
Different websites may use different holdings dates, data sources, security-matching methods, and formulas. Always check the methodology and as-of date before comparing overlap numbers.
How do I compare ETF performance?
Compare the same type of return over the same period. Consider total return as well as price return when appropriate, and review multiple periods rather than focusing on one recent year.
Should I compare ETF dividends or total returns?
If income is important, compare dividends. But total return is also important because it considers both investment appreciation and distributions, depending on the methodology.
What is the difference between an ETF comparison tool and an ETF screener?
An ETF screener helps you find ETFs using filters such as asset class, expense ratio, performance, or strategy. An ETF comparison tool lets you examine selected ETFs side by side.
What is the difference between ETF overlap and ETF comparison?
ETF comparison covers many areas, including fees, holdings, performance, dividends, risk, and fund information. ETF overlap focuses specifically on the amount of exposure shared between funds.
Does past ETF performance predict future returns?
No. Historical performance shows what happened during a particular period. It should not be treated as a guarantee or forecast of future returns.
Final Thoughts
An ETF comparison tool can make ETF research much easier, but the goal should not be to find a fund that wins every category. Instead, use the tool to understand the differences between ETFs.
Compare:
- Expense ratios
- Holdings
- ETF overlap
- Performance
- Dividends
- Risk
- Sector exposure
- Geographic exposure
- Benchmark
- Tracking difference
- Liquidity
- AUM
- Concentration
Most importantly, consider how the ETF fits into your overall portfolio. A fund with the lowest fee may not provide the exposure you need. An ETF with the highest recent return may carry more risk. A fund with hundreds of holdings may still overlap heavily with ETFs you already own. The best ETF comparison is therefore not simply about finding a winner. It is about understanding what you are buying, what it costs, what it owns, how it has behaved, and whether it adds something useful to your portfolio.
Also Visit: ETF Guides & Analysis




Leave a Reply