
A weekly dividend ETF is an exchange-traded fund that makes distributions to shareholders on a weekly basis. These funds have become increasingly popular with investors looking for more frequent cash flow from their portfolios.
But there is an important detail to understand: a weekly ETF distribution is not necessarily the same as a traditional stock dividend. Some weekly-paying ETFs generate income from stock dividends, bonds, option premiums, or other strategies. A distribution can also include a return of capital.
That means a high weekly distribution rate does not automatically mean a high investment return. The U.S. Securities and Exchange Commission (SEC) specifically warns that fund distributions are not guaranteed and that a fund can make distributions while still performing poorly. The SEC recommends looking at measures such as total return and SEC yield rather than relying only on the distribution amount.
In this guide, we explain how weekly dividend ETFs work, where their income comes from, how to compare their yields, what risks to watch, and how to evaluate a fund before investing.
Also Read: ETF and Dividends: How ETF Dividends Work, Yields, Payouts & History
What Is a Weekly Dividend ETF?
A weekly dividend ETF is an ETF that distributes money to shareholders every week or is designed to make weekly distributions. The word “dividend” can be slightly misleading because ETF distributions can come from several sources. Depending on the fund’s strategy, the cash distributed to shareholders may come from dividends, interest, capital gains, option premiums, or return of capital.
The SEC explains that fund distributions can come from income generated by the fund or, in some situations, from a return of capital. This distinction is especially important when researching high-yield weekly income ETFs.
What Does “Weekly Dividend” Mean?
A weekly dividend or distribution simply means investors receive cash more frequently than they would from an ETF that pays monthly or quarterly.
For example, if an ETF distributes $0.20 per share each week, an investor holding 100 shares would receive $20 for that particular weekly distribution. However, the amount can change from one week to another. A weekly distribution should not automatically be treated as a fixed income payment.
Examples of Weekly Dividend and Weekly-Income ETFs
There are now several ETFs that explicitly target weekly distributions. The products differ significantly in their underlying exposure and strategy, so they should not be treated as interchangeable.
Defiance S&P 500 Weekly Distribution ETF (WDTE)
Ticker: WDTE
Underlying exposure: S&P 500
Distribution frequency: Weekly
Strategy: Daily call spreads and S&P 500 exposure
WDTE is one of the clearest examples of a weekly income ETF. The fund seeks current income while also seeking exposure to the S&P 500. According to Defiance ETFs, WDTE is actively managed and designed to generate weekly cash distributions primarily from options premiums. Under normal conditions, it sells daily credit call spreads on the S&P 500 while maintaining long exposure to the index through ETFs and/or synthetic exposure.
As of September 2026, the fund issuer lists a 30% distribution rate and weekly distribution frequency. The issuer also shows a 30-day SEC yield of -0.88% as of August 31, 2026. Those figures illustrate why investors should not treat a distribution rate as equivalent to a conventional dividend yield or expected total return. WDTE’s distribution history also shows weekly payments, with recent September 2026 distributions of approximately $0.166–$0.168 per share.
Defiance Nasdaq 100 Weekly Distribution ETF (QQQY)
Ticker: QQQY
Underlying exposure: Nasdaq-100
Distribution frequency: Weekly
Strategy: Daily call spreads and Nasdaq-100 exposure
QQQY is another example of a weekly distribution ETF. The fund seeks current income while also seeking exposure to the Nasdaq-100 Index. Defiance says QQQY uses daily credit call spreads and maintains long Nasdaq-100 exposure through index-tracking ETFs and/or synthetic exposure.
As of September 2026, Defiance lists a 30% distribution rate and weekly distribution frequency. Its 30-day SEC yield was listed at -0.95% as of August 31, 2026. Recent distributions listed by the issuer include $0.1261 per share for September 18, 2026, $0.1288 for September 11, and $0.1279 for September 4. This is a useful example of why readers should compare distribution rate, distribution history, SEC yield, and total return rather than looking at one number.
Defiance R2000 Weekly Distribution ETF (IWMY)
Ticker: IWMY
Underlying exposure: Russell 2000
Distribution frequency: Weekly
Strategy: Daily call spreads and Russell 2000 exposure
IWMY provides another type of weekly-income exposure. Instead of focusing on the S&P 500 or Nasdaq-100, it seeks exposure to the Russell 2000 Index, which represents small-cap U.S. stocks. Defiance says IWMY uses daily credit call spreads on the Russell 2000 while maintaining long exposure to the index through ETFs and/or synthetic exposure.
As of September 2026, the issuer lists a 30% distribution rate and weekly distribution frequency. The 30-day SEC yield was -0.86% as of August 31, 2026. The fund’s recent distribution schedule also shows weekly payments. For example, the September 18, 2026 distribution was $0.1021 per share, while the September 11 distribution was $0.1055.
Roundhill WeeklyPay™ ETFs
Another growing category is the Roundhill WeeklyPay™ ETF family. Roundhill currently lists a number of ETFs designed to provide weekly distributions and exposure to individual companies or other underlying assets. Its lineup includes:
| Ticker | WeeklyPay ETF | Main Exposure |
|---|
| AAPW | AAPL WeeklyPay™ ETF | Apple |
| AMDW | AMD WeeklyPay™ ETF | AMD |
| AMZW | AMZN WeeklyPay™ ETF | Amazon |
| ARMW | ARM WeeklyPay™ ETF | ARM |
| AVGW | AVGO WeeklyPay™ ETF | Broadcom |
| BABW | BABA WeeklyPay™ ETF | Alibaba |
| BRKW | BRKB WeeklyPay™ ETF | Berkshire Hathaway |
| COIW | COIN WeeklyPay™ ETF | Coinbase |
| COSW | COST WeeklyPay™ ETF | Costco |
| GOOW | GOOGL WeeklyPay™ ETF | Alphabet |
| HOOW | HOOD WeeklyPay™ ETF | Robinhood |
| METW | META WeeklyPay™ ETF | Meta |
| MSFW | MSFT WeeklyPay™ ETF | Microsoft |
| MSTW | MSTR WeeklyPay™ ETF | MicroStrategy |
| NFLW | NFLX WeeklyPay™ ETF | Netflix |
| NVDW | NVDA WeeklyPay™ ETF | Nvidia |
| PLTW | PLTR WeeklyPay™ ETF | Palantir |
| TSLW | TSLA WeeklyPay™ ETF | Tesla |
| UBEW | UBER WeeklyPay™ ETF | Uber |
| UNHW | UNH WeeklyPay™ ETF | UnitedHealth |
| GLDW | Gold WeeklyPay™ ETF | Gold |
| GDXW | Gold Miners WeeklyPay™ ETF | Gold miners |
| TSYW | Treasury Bond WeeklyPay™ ETF | Treasury bonds |
| TOPW | Top WeeklyPay™ ETF | Basket of large U.S. companies |
Roundhill describes its WeeklyPay™ lineup as a group of ETFs designed for weekly income and amplified exposure. The important point is that these funds have very different underlying exposures. An ETF linked to Nvidia, Tesla, gold, Treasury bonds, or a basket of large companies can have very different risks.
AAPW: A Simple Example of How the WeeklyPay Structure Differs
AAPW, the AAPL WeeklyPay™ ETF, is a good example of why investors should read the fund’s strategy before buying. The important point is that these funds have very different underlying exposures. An ETF linked to Nvidia, Tesla, gold, Treasury bonds, or a basket of large companies can have very different risks.
AAPW: A Simple Example of How the WeeklyPay Structure Differs
AAPW, the AAPL WeeklyPay™ ETF, is a good example of why investors should read the fund’s strategy before buying. Roundhill says AAPW seeks weekly distributions while targeting returns corresponding to approximately 120% of Apple’s weekly performance, before fees and expenses. It is an actively managed ETF.
The fund currently has a 0.99% expense ratio according to Roundhill. The issuer also states that weekly distributions are expected but not guaranteed and that distributions can exceed the fund’s income and gains, potentially resulting in return of capital. So AAPW is not simply “Apple stock that pays a dividend every week.” It is a specialized ETF with a particular return target and distribution structure.
Weekly Dividend ETF List: Quick Comparison
Here is a practical starting list for readers researching weekly dividend ETFs and weekly-income ETFs.
| ETF | Ticker | Main Exposure | Weekly Distribution? | General Strategy |
|---|---|---|---|---|
| Defiance S&P 500 Weekly Distribution ETF | WDTE | S&P 500 | Yes | Daily call spreads |
| Defiance Nasdaq 100 Weekly Distribution ETF | QQQY | Nasdaq-100 | Yes | Daily call spreads |
| Defiance R2000 Weekly Distribution ETF | IWMY | Russell 2000 | Yes | Daily call spreads |
| AAPL WeeklyPay™ ETF | AAPW | Apple | Expected weekly | Enhanced single-stock exposure |
| NVDA WeeklyPay™ ETF | NVDW | Nvidia | Expected weekly | WeeklyPay structure |
| TSLA WeeklyPay™ ETF | TSLW | Tesla | Expected weekly | WeeklyPay structure |
| MSFT WeeklyPay™ ETF | MSFW | Microsoft | Expected weekly | WeeklyPay structure |
| COIN WeeklyPay™ ETF | COIW | Coinbase | Expected weekly | WeeklyPay structure |
| Gold WeeklyPay™ ETF | GLDW | Gold | Expected weekly | WeeklyPay structure |
| Gold Miners WeeklyPay™ ETF | GDXW | Gold miners | Expected weekly | WeeklyPay structure |
| Treasury Bond WeeklyPay™ ETF | TSYW | Treasury bonds | Expected weekly | WeeklyPay structure |
| Top WeeklyPay™ ETF | TOPW | Large U.S. companies | Weekly | Diversified WeeklyPay exposure |
Roundhill’s current ETF lineup confirms these WeeklyPay products and identifies their underlying exposures.
Important: This is an example list, not a ranking. Distribution frequency, rates, strategies, fees, and fund structures can change. Always check the fund issuer’s latest information before making an investment decision.
What Is the Difference Between WDTE, QQQY and IWMY?
These three Defiance ETFs have a similar weekly-income concept but different underlying market exposure.
| ETF | Index/Exposure | Income Strategy | Main Market Exposure |
|---|---|---|---|
| WDTE | S&P 500 | Daily call spreads | Large U.S. companies |
| QQQY | Nasdaq-100 | Daily call spreads | Large growth/technology-heavy companies |
| IWMY | Russell 2000 | Daily call spreads | U.S. small-cap companies |
The key difference is not simply the distribution frequency. The underlying index can have a major effect on risk and performance. For example, an investor comparing QQQY and IWMY is comparing exposure to two very different parts of the U.S. equity market even though both funds make weekly distributions.
What Is the Difference Between WeeklyPay ETFs and Traditional Dividend ETFs?
This is another distinction readers should understand. A traditional dividend ETF may own a diversified portfolio of companies selected because of dividend payments, dividend growth, quality, value, or another factor. A WeeklyPay ETF may instead use derivatives or other strategies to generate weekly distributions while providing exposure to a particular stock, asset, or basket.
For example, AAPW is designed around Apple exposure and a weekly return target, while WDTE focuses on S&P 500 exposure and daily call spreads. Therefore, the phrase “weekly dividend ETF” covers several different types of products. Investors should always look at the individual fund’s strategy.
Are These Really Dividend ETFs?
Not necessarily. This is why weekly distribution ETF can be a more accurate term. For example, Defiance states that its weekly distributions are generated primarily from options premiums. Roundhill also warns that distributions from its WeeklyPay ETFs may exceed the fund’s income and gains and can therefore include return of capital.
This distinction matters because an investor might see a very high distribution rate and assume that the ETF is producing that amount of dividend income from its underlying stocks. That assumption can be wrong.
How Do Weekly Dividend ETFs Work?
The way a weekly dividend ETF generates income depends on the fund. Some ETFs hold dividend-paying stocks or bonds. Others use options strategies to generate premiums that can contribute to distributions.
Many of the newer weekly-income ETFs use actively managed options strategies. For example, some funds sell short-dated options or call spreads to generate option premium income. Current funds in this category include products designed around weekly distributions from options strategies.
Covered-Call Strategies
A covered-call strategy generally involves owning an underlying asset or obtaining exposure to it while selling call options.
The ETF receives option premiums from selling those options. Those premiums can become an important source of the fund’s income. The trade-off is important. By selling calls, the fund may give up some potential upside when the underlying asset rises sharply. In exchange, it receives option premium that can help generate current income. This means a covered-call ETF should not be evaluated in the same way as a traditional dividend-growth ETF.
0DTE Options
You may also see the term 0DTE, which means “zero days to expiration.” These are options that expire on the same trading day they are used. Some newer ETFs use 0DTE strategies as part of their income-generation process.
The strategy can be complex, so investors should read the fund’s prospectus and understand exactly how the options are used instead of assuming that a weekly distribution is simply a regular stock dividend.
Where Does the Money for a Weekly Distribution Come From?
Depending on the ETF, distributions may come from:
- Stock dividends
- Bond interest
- Option premiums
- Realized capital gains
- Other investment income
- Return of capital
The exact source matters because two ETFs can have similar distribution rates but very different investment strategies and risk profiles.
Are Weekly ETF Payments Really Dividends?
Not always. The more precise term is often weekly distribution. A traditional company dividend is generally a payment made by a corporation to its shareholders. An ETF, however, is a fund that holds investments and passes certain income and gains through to its shareholders.
The SEC notes that fund distributions may include dividends, interest, capital gains, or return of capital. Therefore, when researching a weekly dividend ETF, check the fund’s distribution details rather than assuming that every dollar distributed is ordinary dividend income.
Weekly Dividend ETF Yield vs. Distribution Rate
This is one of the most important concepts to understand. A distribution rate is not the same thing as your total investment return. A fund may advertise a very high annualized distribution rate, but that does not mean investors are guaranteed to earn that percentage.
The SEC explicitly states that a fund’s distributions are not the same as its performance. It recommends considering total return and standardized yield when evaluating fund performance.
What Is a Distribution Rate?
A distribution rate generally attempts to show the pace of recent distributions on an annualized basis. For example, imagine an ETF distributes $0.10 per share in one week and its share price is $10.
That would be: $0.10 ÷ $10 = 1% for that week
If that single weekly payment were simply annualized, the resulting number could look extremely large. But that does not mean the ETF will actually distribute the same amount every week for a full year. This is why investors should avoid treating a headline distribution rate as a guaranteed annual return.
Distribution Rate vs. Total Return
Consider these two measurements:
| Metric | What It Tells You |
|---|---|
| Distribution rate | Recent pace of cash distributions |
| Dividend yield | Income relative to investment price |
| NAV return | Change in the fund’s net asset value |
| Price return | Change in ETF market price |
| Total return | Investment performance including distributions |
The total return gives you a much better picture of whether an investment actually created or lost value over a period. An ETF could distribute a large amount of cash while its share price or NAV declines. That is why simply searching for the highest weekly dividend ETF can be misleading.
Also Read: ETF Overlap: How to Compare ETF Holdings and Avoid Portfolio Duplication
Why Can a Weekly Dividend ETF Have a High Yield?
High distribution rates can occur for several reasons. An ETF may be using an options-income strategy, operating in a highly volatile market, holding assets with substantial income potential, or annualizing a recent distribution.
Some weekly ETFs specifically target high levels of cash distribution through options strategies. For example, the Defiance S&P 500 Weekly Distribution ETF describes its strategy as generating weekly cash distributions primarily from options premiums. But higher distributions can come with additional risks. The fund may sacrifice some upside, experience greater volatility, have a concentrated portfolio, or distribute amounts that are not fully supported by investment income.
Weekly Dividend ETF and Return of Capital
Return of capital, often abbreviated as ROC, is another important topic that investors should understand. A return of capital means some or all of a distribution represents a return of the investor’s own invested capital rather than income generated by the fund.
The SEC explains that return of capital can reduce the fund’s asset base and may limit future growth or contribute to losses in the remaining investment. This does not automatically mean that every ETF using return of capital is unsuitable. The important point is to understand what is behind the distribution. If an ETF repeatedly pays distributions that are not fully supported by income or gains, the headline yield can give an incomplete picture of the investment.
How to Choose a Weekly Dividend ETF
Instead of asking only, “Which weekly dividend ETF has the highest yield?”, use a broader checklist.
Check the Distribution History
Look at how the ETF’s distributions have changed over time.
Ask:
- Have payments been consistent?
- Have distributions increased or decreased?
- Are some payments unusually large?
- Does the fund frequently change its distribution?
- How long has the ETF been making weekly distributions?
A single large payment tells you very little about long-term income.
Check Total Return
Total return combines changes in the investment’s value with distributions. This is critical because a fund can have a high distribution rate while its share price or NAV falls.
Check NAV Performance
NAV, or net asset value, represents the value of the securities and other assets held by the fund, minus its liabilities. ETF market prices can trade above or below NAV. The SEC notes that ETF shares trade on exchanges and can trade at a premium or discount to NAV.
Check the Expense Ratio
ETF expenses reduce investor returns. The SEC explains that fund fees and expenses reduce investment returns and that investors should review the standardized fee information in a fund’s prospectus.A high distribution rate does not make a fund’s expenses irrelevant.
Check the Underlying Assets
Ask what the ETF actually owns or is exposed to.
It could be:
- The S&P 500
- Nasdaq-100
- Individual stocks
- Technology stocks
- Bonds
- REITs
- Options
- Other ETFs
- A combination of assets
An ETF paying weekly distributions does not automatically provide broad diversification.
Check the Options Strategy
If the ETF uses options, understand the strategy.
Look for terms such as:
- Covered call
- Call spread
- Cash-secured put
- 0DTE
- Synthetic covered call
- Option-income strategy
You should understand what happens to the fund when the underlying market rises sharply, falls sharply, or remains flat.
Check the Fund’s Age
A recently launched ETF may not have a long track record. A fund with only a few months of distribution history cannot provide the same amount of historical information as an ETF with several years of operating history.
Check Assets Under Management and Liquidity
Larger assets and higher trading volume can sometimes make an ETF easier to trade, although neither measure guarantees better performance. Also check the bid-ask spread because trading costs matter, particularly if you buy or sell frequently.
Weekly Dividend ETF Comparison: What to Look At
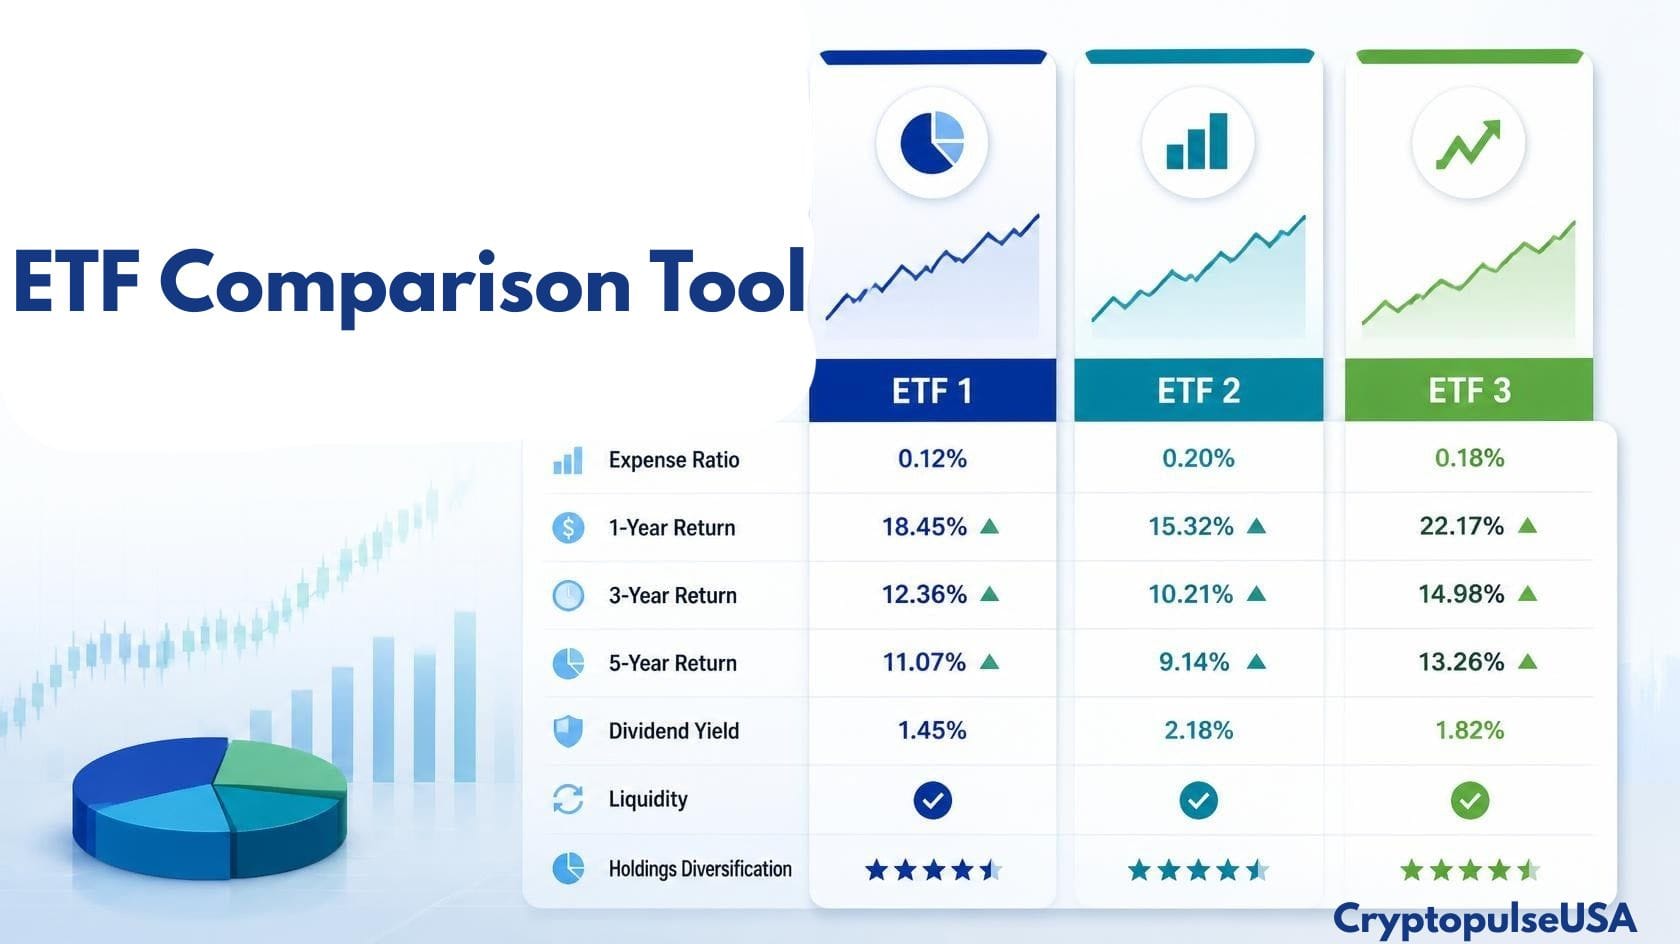
When comparing weekly income ETFs, consider building a table with these columns:
| Factor | Why It Matters |
|---|---|
| Ticker | Identifies the ETF |
| Strategy | Shows how income is generated |
| Distribution frequency | Confirms weekly payments |
| Distribution rate | Shows recent distribution pace |
| SEC yield | Provides another income measure where applicable |
| Expense ratio | Shows fund costs |
| AUM | Indicates fund size |
| NAV performance | Shows underlying fund-value changes |
| Total return | Helps evaluate overall performance |
| Inception date | Shows how long the fund has existed |
| Underlying exposure | Shows what drives the fund |
| Option strategy | Helps explain income and risk |
The exact figures should be checked against the fund issuer’s latest information before publication because distribution rates, prices, and other market data can change.
Also Read: ETF Comparison Tool: Compare ETFs Side by Side
Highest-Yielding Weekly Dividend ETFs
Searching for the highest-yielding weekly dividend ETF is a common starting point, but yield should not be the only selection criterion. A very high distribution rate can be influenced by option premiums, market volatility, the fund’s strategy, or the way a recent distribution is annualized. The SEC warns that investors should not rely solely on fund distributions to understand performance.
A better approach is to compare: Distribution rate + total return + NAV trend + strategy + expenses + risk.
That combination gives you a much clearer picture.
Weekly Dividend ETF vs. Monthly Dividend ETF
The main difference is how frequently the fund distributes money.
| Feature | Weekly Dividend ETF | Monthly Dividend ETF |
|---|---|---|
| Distribution frequency | Weekly | Monthly |
| Cash-flow frequency | More frequent | Less frequent |
| Payment amount | Often smaller per payment | Often larger per payment |
| Strategy | Varies; many use specialized income strategies | Wide range of strategies |
| Income predictability | Depends on fund | Depends on fund |
| Risk | Depends on underlying strategy | Depends on underlying strategy |
A weekly payment schedule can be convenient for someone who wants frequent cash flow, but receiving money every week does not by itself create a higher total return.
Weekly Dividend ETF vs. Dividend Stocks
A dividend stock represents ownership in an individual company. A dividend ETF owns a portfolio of investments, which can provide diversification depending on the fund.
| Feature | Weekly Dividend ETF | Individual Dividend Stock |
|---|---|---|
| Diversification | Depends on ETF | Usually one company |
| Payment frequency | Can be weekly | Usually quarterly, sometimes monthly |
| Strategy | Can use options or other techniques | Company decides dividend policy |
| Company-specific risk | Depends on holdings | Higher for a single company |
| Fund expenses | Yes | No ETF expense ratio |
| Options exposure | Common in some weekly-income ETFs | Depends on investor/company |
| Research required | Fund and strategy | Individual company |
Neither structure should be judged solely by payment frequency.
Advantages of Weekly Dividend ETFs
Weekly income ETFs can have several potential uses.
More Frequent Cash Flow
Investors who prefer regular cash distributions may find weekly payments easier to track.
Potential Income Flexibility
Frequent distributions can provide cash that an investor may choose to spend or reinvest.
Reinvestment Opportunities
If distributions are reinvested, the cash can be used to purchase additional ETF shares.
Access to Specialized Income Strategies
Some weekly ETFs give investors access to options strategies without requiring them to trade options directly. However, the convenience of an ETF does not remove the underlying investment risks.
Risks of Weekly Dividend ETFs
A high-income ETF can have substantially different risks from a traditional dividend-growth ETF.
High Distribution Does Not Mean High Return
This is the biggest mistake investors make. A distribution is cash leaving the fund and going to shareholders. It is not automatically additional wealth.
The SEC states that distributions are not the same as fund performance and that a fund can perform poorly while continuing to make distributions.
Covered-Call Upside Risk
When a fund sells calls, some potential upside can be exchanged for option premium income. If the underlying asset rises substantially, the strategy may not participate fully in that increase.
Underlying Asset Risk
If the ETF is concentrated in one company, industry, index, or asset class, the fund can experience significant losses when that exposure performs poorly.
Distribution Cuts
Weekly payments are not guaranteed. A fund can change its distribution amount depending on its strategy, market conditions, income generation, and other factors.
NAV Decline
An attractive distribution can become less attractive if the fund’s NAV continually declines.
Return-of-Capital Risk
Repeated return-of-capital distributions can reduce the fund’s asset base. The SEC specifically recommends understanding the source of distributions.
Expense Risk
Higher expenses reduce the amount of return available to investors.
Strategy Complexity
Some weekly ETFs use sophisticated derivatives and short-dated options. If you cannot explain how the ETF generates its income, read the fund’s prospectus before investing.
How Much Money Do You Need to Generate $100 a Week?
A simple mathematical example can help explain the relationship between capital and income.
$100 per week equals: $100 × 52 = $5,200 per year
Suppose, purely as a hypothetical example, an investment produced a sustainable 10% annual distribution rate.
The mathematical capital requirement would be: $5,200 ÷ 0.10 = $52,000
At a hypothetical 5% rate: $5,200 ÷ 0.05 = $104,000
These are illustrations, not forecasts. A distribution rate can change, the ETF’s price can fall, and the investor’s total return can be negative even while cash distributions are being received.
How to Build a Weekly Income ETF Strategy
A simple research process can make comparing funds easier.
Step 1: Set Your Income Target
Decide how much cash flow you actually need.
For example:
- $100 per week
- $250 per week
- $500 per week
- $1,000 per week
Then convert the weekly target into an annual amount.
Step 2: Determine Your Risk Tolerance
A high distribution strategy can involve higher market, options, concentration, or capital-loss risk. Do not choose a fund based solely on its advertised distribution.
Step 3: Compare Distribution History
Review the actual distribution record rather than one recent payment.
Step 4: Compare Total Return
Look at total return over appropriate periods.
Step 5: Review NAV
Check whether the fund’s NAV has been stable, growing, or declining.
Step 6: Understand the Strategy
Read the fund’s prospectus and website.
The SEC recommends reviewing an ETF’s prospectus and shareholder reports before investing.
Step 7: Review Fees
Compare expense ratios and other trading costs.
Step 8: Consider Diversification
Understand exactly what drives the ETF’s performance.
Are Weekly Dividend ETFs Safe?
There is no simple “safe” label that applies to every weekly dividend ETF. Risk depends on the fund’s underlying assets, options strategy, leverage if any, concentration, market conditions, fees, and distribution structure. A weekly payment schedule should not be confused with capital protection. The SEC notes that investors can lose money in a fund that pays distributions.
Are Weekly Dividend ETF Distributions Guaranteed?
No. ETF distributions are not guaranteed. A fund may change its distribution amount, reduce distributions, or use different sources of cash to fund distributions. Always check the ETF issuer’s latest distribution information and prospectus.
How Are Weekly ETF Distributions Taxed?
Tax treatment depends on the type of distribution and the account in which you hold the ETF. In a taxable brokerage account, distributions may create tax consequences even if you automatically reinvest them.
The SEC explains that taxable distributions can include capital gains, interest, and dividend income. Return of capital generally is not taxable when received, but it can reduce your cost basis and potentially increase taxable gains when you sell. Your actual tax treatment depends on your circumstances, so review the fund’s tax documents and consult a qualified tax professional when necessary.
Should You Reinvest Weekly ETF Distributions?
That depends on your objective. If your goal is current cash flow, you may choose to receive distributions as cash. If your goal is to grow your position, you may choose to reinvest distributions.
Reinvestment can increase the number of shares you own over time, but it does not remove market risk. The SEC notes that investors may have the option to reinvest fund distributions and that reinvestment can help grow an investment over time.
Common Mistakes When Choosing a Weekly Dividend ETF
Mistake 1: Choosing the Highest Yield
A high distribution rate does not automatically mean a high total return.
Mistake 2: Confusing Distribution With Profit
Receiving cash does not necessarily mean the investment has increased in value.
Mistake 3: Ignoring NAV
Always look at the underlying fund value.
Mistake 4: Ignoring the Options Strategy
Understand how the ETF generates income.
Mistake 5: Looking at Only One Week
One unusually high payment is not enough to establish a sustainable income pattern.
Mistake 6: Ignoring Fees
Fund expenses reduce returns.
Mistake 7: Assuming Weekly Means Stable
Weekly payments can change.
Mistake 8: Ignoring Taxes
Reinvested distributions can still have tax consequences in taxable accounts.
Mistake 9: Ignoring the Underlying Investment
A weekly distribution does not make a risky underlying asset less risky.
Weekly Dividend ETF Research Checklist
Before investing in any weekly dividend ETF, check:
- Distribution frequency
- Distribution history
- Distribution rate
- SEC yield, where applicable
- Total return
- NAV performance
- Expense ratio
- Assets under management
- Trading volume
- Bid-ask spread
- Fund inception date
- Underlying holdings
- Options strategy
- Concentration
- Leverage, if any
- Return-of-capital history
- Tax information
- Prospectus
- Recent shareholder report
This checklist is more useful than choosing an ETF from a headline yield alone.
FAQs About Weekly Dividend ETFs
What ETF pays dividends weekly?
There are ETFs designed to make weekly distributions. Many newer products use options-income strategies, although the exact strategy varies by fund. Some funds describe their weekly distributions as being generated primarily from option premiums.
Are there ETFs that pay dividends every week?
Yes. Weekly-distribution ETFs exist, but investors should check the fund’s official distribution schedule because payment policies can change.
How do weekly dividend ETFs work?
They generate income through the investments or strategies used by the fund. Depending on the ETF, this can include stock dividends, bond interest, option premiums, capital gains, or other sources.
How do weekly dividend ETFs work?
A weekly distribution does not guarantee safety. The risk depends on the ETF’s holdings, strategy, volatility, options exposure, concentration, fees, and other factors.
How much does a weekly dividend ETF pay?
The amount varies by ETF and can change from week to week. Investors should check the latest official distribution announcement instead of assuming that a previous payment will continue.
What is the highest-yielding weekly dividend ETF?
The answer can change frequently because distribution rates and ETF prices change. More importantly, the highest distribution rate is not necessarily the highest total return. Compare distribution history, total return, NAV performance, fees, and strategy before drawing conclusions.
Can you live off weekly ETF dividends?
It is possible for an investor to use investment distributions as part of an income strategy, but whether the income is sufficient depends on portfolio size, distribution rates, taxes, spending needs, and investment performance.
Can you live off weekly ETF dividends?
It is possible for an investor to use investment distributions as part of an income strategy, but whether the income is sufficient depends on portfolio size, distribution rates, taxes, spending needs, and investment performance.
Are weekly dividend ETFs taxable?
Distributions held in taxable accounts can have tax consequences. The tax treatment depends on whether the distribution is classified as dividend income, interest, capital gain, return of capital, or another category.
What is the difference between a weekly distribution and a dividend?
A dividend usually refers to income paid by a company to shareholders. An ETF distribution is money paid by the fund to its shareholders and can come from several sources.
Is a high distribution rate the same as a high return?
No. Distribution rate measures cash distributions, while total return considers both the investment’s change in value and distributions. The SEC specifically warns investors not to rely solely on distributions when evaluating fund performance.
Final Thoughts on Weekly Dividend ETFs
A weekly dividend ETF can be useful for investors who want more frequent cash distributions, but the payment schedule should not be the main reason for choosing a fund. The most important question is not simply “How much does this ETF pay every week?”
Instead, look at the complete picture:
Where does the distribution come from? How has the NAV performed? What is the total return? What strategy does the ETF use? What are the expenses? How concentrated is the portfolio? And what risks could affect future distributions?
Weekly income can look attractive on a screen, especially when a fund advertises a very high distribution rate. But a high distribution is not automatically the same as a high return.
Taking the time to understand the ETF’s strategy, distribution history, NAV, total return, expenses, and tax treatment can help you make a more informed decision.
Also Visit: ETF Guides & Analysis
This article is for educational purposes only and is not financial, investment, tax, or legal advice. ETF distributions, prices, yields, and strategies can change. Review the latest fund documents and consider your own circumstances before making an investment decision.


Leave a Reply